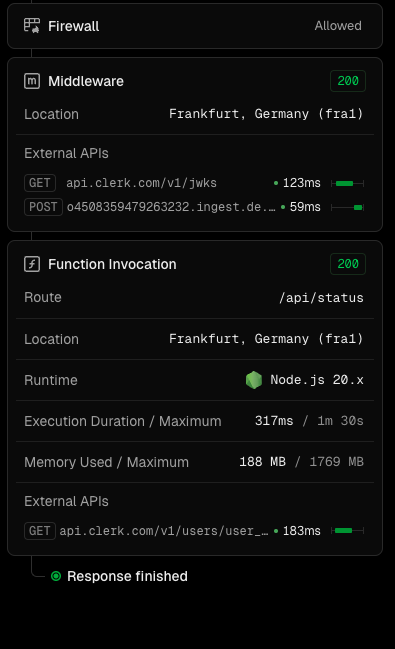
I think the observability insights in the logs are pretty cool, but our application is getting the data in RSCs 99% from db queries and not from fetches. Having a similar UI with query duration for queries would be great.
Is there an Observability API that I can use to add traces?
Yes, you can add custom traces for your database queries using Vercel’s OpenTelemetry integration.
Vercel’s Observability platform supports custom instrumentation through OpenTelemetry, which allows you to add traces for your database queries similar to how fetch requests are automatically traced.
Here’s how you can get started:
First, install the OpenTelemetry packages:
npm install @vercel/otel
You can use it to create spans for your database queries:
import { trace } from '@vercel/otel';

async function fetchDataFromDB() {
  return trace.span('db.query', async (span) => {
    // Add details about your query
    span.setAttribute('db.system', 'postgresql'); // or whatever DB you use
    span.setAttribute('db.statement', 'SELECT * FROM users');

    // Your actual database query
    const result = await db.query('SELECT * FROM users');

    // You can record the size of the result
    span.setAttribute('db.result.size', result.length);

    return result;
  });
}
This will create traces that show up in your Vercel Observability dashboard with timing information similar to the fetch requests.
Long story short: The span is not showing up in the Vercel logs. Please provide some link to documentation or code from an actual API that can be used to track performance of custom code to show up in the log details. I’m not interested to send spans to New Relic or Datadog.